
The Hidden Cost of Cheap Solar and Battery Installations
November 21, 2025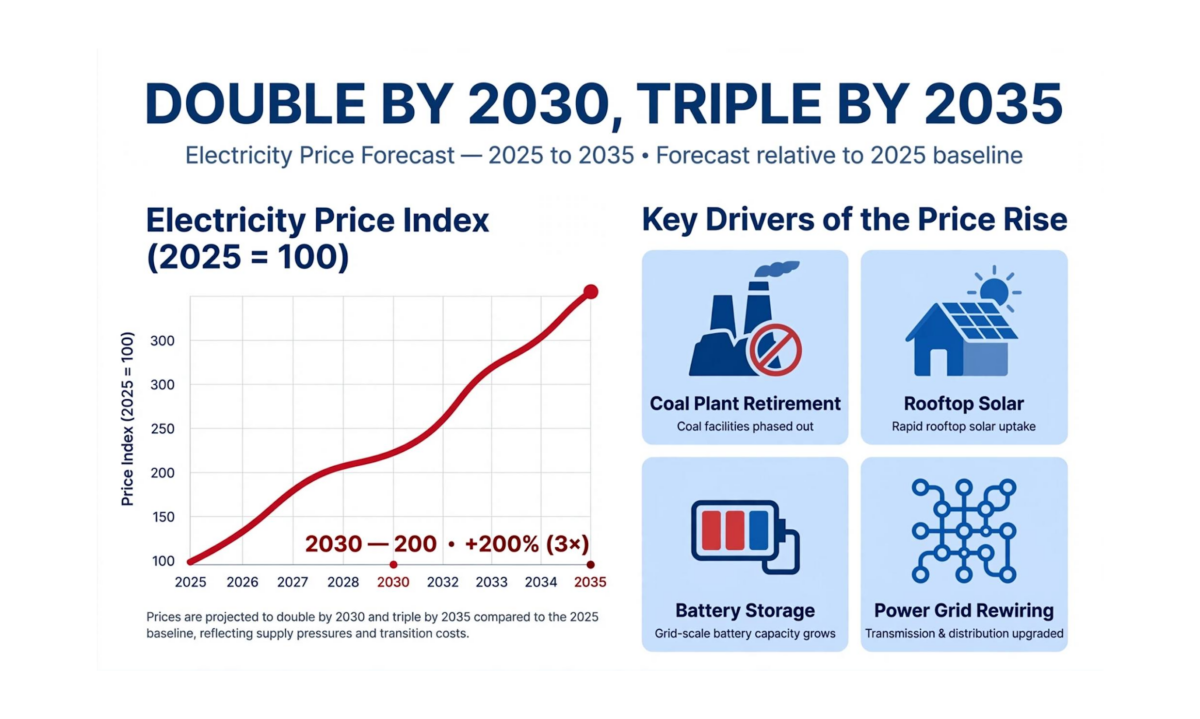
Double 2025 Electricity Bills By 2030 And Triple By 2035: A Review Of The Inflationary Outlook Associated With The Government’s Net Zero Policy
By Alex Daniels, Energy Consultant at TSBA
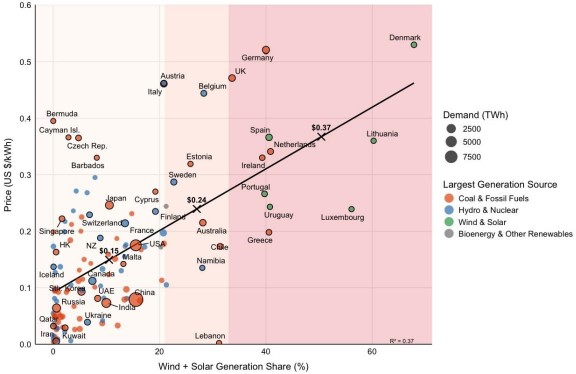
Paying double what we pay now for electricity in just 4 years then paying double again in 9 years seems excessive but it is close to what countries like Denmark, Germany or States like California are paying for their electricity post a push for a higher share of renewables as part of their overall energy mix.
The way politicians frame the discourse on renewables to say the very least lacks candour.
Yes it is true that electricity will be significantly cheaper for those who install solar on their roofs but those who don’t will have to face unaffordable electricity prices on the grid. The key finding of this report are that:
- Comparative country analysis shows that what causes high electricity price inflation is targeting renewables to generate more than 30% of the overall electricity mix. Australia is targeting 82% of its electricity to be generated by renewables by 2030 which is significantly higher than both Denmark and Germany where electricity prices are currently 130% higher than they are in Australia. Less than 60% of Australia’s small population is still supporting the grid. The rest are generating their own electricity through solar. That ought to mean Australia may end up with the highest electricity prices in the world by 2030.
- Analysis of wholesale electricity prices and the determinants of inflation in that area shows that the two key factors which have caused a 413% inflation between 2015 and 2025 are coal power plant retirements and the high uptake of rooftop solar.
- The cost of storing renewable electricity when targeting a high proportion of electricity being generated by renewables tends to be much higher than initially anticipated. Rewiring of the grid needs to take place to accommodate two-way electricity generation. For a country as large as Australia, that cost would come with a high price tag.
- Increased electricity prices will lead to more people seeking to generate their own cheaper electricity through solar leaving less people to support the grid and causing prices on the grid to become unaffordable.
Overall, we find that the cost increases to be expected for electricity are at least 100% by 2030 and 150-200% 2025 levels by 2035 if not more.
Past evolution of electricity prices in Australia
This section aims to explain how the electricity market has evolved in the recent past so that we can use this information in our future projections.
The regular distribution of electricity prices historically has been split between peak and off-peak times with tariffs to match. The introduction of solar in Australia has created a dilemma for electricity retailers (AGL, Origin etc…).
In 2011, the government launched a program to tax coal power plants for their electricity production using a carbon offset system. At that point, renewables only accounted for 1.5% of the overall energy use. By 2025, they accounted for 30%+.
By 2015, the government started retiring coal power plants to replace cheap electricity generation on the grid with cheap electricity generation off the grid. This was the first time that we began to see wholesale electricity prices break out of the trading range they had been in since 1998.
From 2015 to 2025, an average of 300,000 households installed rooftop solar. This created a twofold problem for utility retailers: 1) they were losing 3% of their customer base every year. 2) that customer base relied on their solar exports during the day to offset their consumption at night. Too much electricity was being sent to the grid in the daytime and not enough at night.
As a result of the oversupply of daytime electricity, the feed-in tariffs those who had installed solar were reliant on started to steadily go down. In the state of Victoria, they went to zero. Electricity prices during the day went down and electricity prices at night went up to compensate daytime losses incurred by power companies.
Between 2015 and 2025 the share of renewables in the overall electricity mix went from 14.6% to 43%. This caused wholesale electricity prices which account for 35% of electric bills to increase by 413% resulting in what ought to have been a net increase in electric bills of 144%. In actuality, they only went up by 60-70%. That means there’s an inflationary backlog of 74-84% that if nothing changes still needs to be passed on to consumers.
By 2025, utility companies had lost 33% of their household customer base yet they still had the same fixed costs to cover and couldn’t do so at a loss. They responded to this marketplace change by introducing smart meters and lobbying the government to make those installations mandatory. Smart meters allow utility companies to narrow down the consumption usage of a household. Utility companies added a pricing component to bills they called the shoulder price, priced not too far off from the peak price and set out to make up for the losses incurred from people who were no longer using the grid for their power supply. We believe that’s how the inflationary backlog on the wholesale electricity market was resolved.
This now creates a situation where people have even more of an incentive to install solar. The number of households installing rooftop solar hasn’t diminished in 2025 and they now have a new incentive to do so with the extra charges incurred through smart meter bills. Households have a choice: either face spiralling electricity prices or install rooftop solar and battery and generate their own electricity at a lower cost.
To offset the increase in prices at peak and shoulder times, the government launched the battery rebate program in July 2025. The goal of the program was to reduce the cost of electricity at night for those who didn’t have solar by reducing the demand for grid power through battery installations.
In 2024, the government launched a mass wind turbine installation program requiring significant investment in both wind and storage. The investment in storage was so large that fearing public outrage, the government had to hide how much Net Zero was going to cost Australians by using secret capacity investment schemes which are not for publication in the Budget papers. The real cost of net zero is a documentary that discusses this issue alongside all of the additional electricity costs Australians will face in future.
Note that all it took for wholesale prices to go up that much was a 28.4 percentage point increase in renewables to the overall electricity mix. By 2030, the government’s Net Zero target is 82% of the electricity generated in Australia to come from renewables. That’s equivalent to a 39-percentage point increase from 2025. In only 4 years, the government is going to increase renewable electricity generation by 1.37 times what it did over 10 years, during a period where wholesale electricity prices went up 413%.
Electricity inflation modelling up to 2030 and into 2035
Future wholesale price increase modelling is the easiest component of electricity bills to model when it comes to overall electricity prices because the information is in the public domain and comes directly from the Australian Energy Regulator (AER) (1).
Because we know that the two biggest events that caused wholesale electricity prices between 2015 and 2025 to quadruple was coal power plant retirement and the increase in renewable energy uptake, we can extrapolate the impact of these two dependent variables into the future to get an idea of what electricity prices will look like for consumers in the future. This in turn helps us assess the attractiveness of considering energy trading as a solution to maximise electricity exports back to the grid.
To recap, between 2015 and 2025, Australia retired 8 GW of coal power plant capacity and the increase in renewables as part of the overall electricity mix went from 14.6% to 43%.
The government now has a target to generate 82% of the overall electricity supply mix from renewables by 2030. At the same time, it wants to retire 15-18 GW in coal power plant capacity.
Between 2026 and 2030, the share of renewables as part of the overall electricity mix will increase by 1.37 times what it did in the 2015-25 period. Taking into account the equivalent 8 GW in coal power plant retirement, we come up with a wholesale electricity price inflation number of 567% equating to a 198% increase in electric bills. But that’s not all. We are still left with 7 to 10 GW in coal power plant retirement which has not been accounted for.
We cannot be certain that coal power plants will be retired according to target because the government won’t retire them if it thinks that their retirement would cause rolling black outs. However, if the wind turbine projects are able to go ahead according to plan (they do face significant local community opposition), then we estimate that a conservative extrapolation of this retirement capacity would likely equate to 25% of the overall inflation we saw in the 2015-25 period. This would equate to a 103% increase in wholesale prices and a 36% increase in electricity prices. In total, the modelling indicates that electricity prices by 2030 would increase by 234%. This equates to a 30% annual inflation rate.
The modelling only takes into account the impact of the addition of renewables and coal power plant retirement on wholesale electricity prices because those were the key drivers affecting wholesale electricity prices between 2015 and 2025. What’s going to be different between 2026-2030 is that more wind power is going to come online than it did in the 2015 to 2025 period. The impact of this wind power generation will be that it will replace coal and so as a result of this, we ought not to see electricity bill inflation above 198%.
If we compare the cost of building coal power plants from scratch to supply Australia’s electricity’s 2035 demand and a combination of rooftop solar and wind turbines, the costs on paper are about the same. Renewable energy is slightly more expensive. So why have we had so much inflation then?
The inflation is not due to costs of renewables being higher it’s due to people no longer supporting the grid post solar rooftop installations and a reduced population of people available to cover the fixed costs of electricity generation. This is the key to understanding future electricity price inflation in Australia. Price must adjust upwards to reflect the smaller population size funding the grid. The future is not on the grid, the future is in micro-grids. They are more cost effective than a centralised grid for an economy generating its power from renewables.
When we compare renewables to coal power plants, the cost of building a coal power plant is much cheaper. But the cost of build is irrelevant compared to the cost of coal and when the comparison is made over 15 years between the cost of coal required and coal plant construction costs to its renewable energy build equivalent, the cost differential is not particularly large (see appendix 1). Renewables are perhaps 50% more expensive, nowhere near expensive enough to justify the 60-70% increase we have seen in electricity bills.
The cost of coal over 15 years is 15 times the cost of the construction of a coal power plant. Coal power for the whole of Australia over 15 years would cost $537 billion from new coal plants whereas 48-56% of the country’s 2035 needs coming from wind generation would come at a cost of $221 to $419 billion depending on the technology used for storage. To compare like for like, the cost of renewables if they came only from wind would fall in a bracket between $442 billion and $838 billion at 100% of supply. At most renewables are 56% more expensive not accounting for financing costs.
Come 2030, 48-56% of Australia’s electricity consumption will be met by wind power. That should put a dampener on electricity price inflation. Even when we factor in the cost of all of the energy from wind power being stored in batteries it doesn’t seem to be excessively priced. To ascertain what power consumption will look like by 2035, we’ve created a macro analysis of what aggregate demand ought to be if government targets are met (see Appendix 2).
There’s an oversight in our analysis. Our analysis assumes that the installation of wind farms across the nation requires a standard amount of battery storage. In practice, required battery storage is a function of the percentage of renewables used in the overall energy mix. The oversight was discovered through a study of “The Renewable Energy Honeymoon is over” report by the institute for independent studies. A summary of the key points made by the report is available in Appendix 3. The main argument this report makes is that moving renewable energy through time and space creates costs overruns and the higher the penetration required (renewable energy generation as percentage of the overall electricity mix), the higher the cost overruns. Storage invariably ends up being more expensive than initially thought, even more so when a country is aiming to generate most of its energy from renewables. Australia’s 82% penetration rate target is higher than Denmark and Germany where prices are 130% higher than they are here at penetration rates of only 65% and 40% respectively (see appendix 3). Australia is about 22 times larger than Germany and 180 times larger than Denmark. Size does matter in electricity for wiring and for moving electricity across time and space. Whatever inflation was experienced in Germany and Denmark, it would be reasonable to add a 1.25 to 1.5x factor to account for Australia’s larger size. With Australia’s larger size factored in at an 82% renewables penetration rate, 2030 electricity prices would be between 376 and 450% higher than 2025 levels. Today the retail price of 1 kWh is 0.35 cents on average. By 2030, it could be as high as $1.33 and $1.6 per kWh.
We don’t think they’ll go that high or at least we hope not. The government will have to reduce its 82% target as it becomes obvious that it’s economically completely unviable.
This benchmarking nonetheless validates our inflation forecast of a doubling of electricity prices by 2030 and then perhaps another doubling by 2035. It’s hard to know for sure exactly how much inflation we would have but double to triple current prices to account for the high cost of battery storage, rewiring of the grid and less people supporting the grid seems like a reasonable estimate.
We built our renewable power supply cost models based on the standard assumption that 30% battery capacity is required for a wind farm project. This provides approximately 2 to 4 hours of storage. But under an 80-85% renewable penetration rate, storage requirements are estimated at 6 to 12 hours of capacity or more, to manage variability, daily and weekly supply-demand gaps. Higher renewable shares increase the need for storage by a factor of 2-5 compared to low renewable scenarios, resulting in higher investment costs and storage capacity needs. Adjusting our model, the cost of powering the whole country with renewables could be as high as 3 times that of coal and as low as 1.25-1.5 times that of coal if the government waited for battery technology to become cheaper.
How much solar is left to install across the whole of Australia?
As we’ve discussed, the key determinant of electricity price inflation is the number of households and businesses no longer funding the grid by installing solar. So the question is just how far can that trend go?
Over 4.15 million rooftop solar systems are installed on Australian households and businesses combined. This includes about 3.85 million residential households and around 300,000 small business systems with rooftop solar. 38.5% of Australian households have solar. Approximately 66% of Australian households own their homes. That still leaves 27.5% a little less than half of the capacity of what has already been installed. Add to this scope for power purchase agreements for the remaining 37% of households who are tenants and there’s still a lot of scope for solar installations to continue growing. We expect two phases: from 2026-2030 we expect solar installations to continue growing at a rate of 300-330,000 a year. Post 2030, solar will still be attractive but either sales will slow, or power purchase agreements will become a popular alternative to ownership. PPAs are very popular in the US. In Europe, the withdrawal of incentive schemes without adequate replacements has led to a collapse of more than 60 percent in some rooftop markets compared with 2023, while Poland, Spain, and Germany have seen drops of over 40 percent (4).
The average payback period for solar panels on an Australian household without subsidies and batteries typically ranges between 3.5 to 6 years, depending on location, electricity prices, and system size. Adding batteries typically increases payback periods to around 5 to 7 years or more because of the higher upfront system cost. Falling solar system prices and rising electricity prices continue to improve the payback timeline.
EV uptake to further increase rooftop solar installation demand:
The introduction of the New Vehicle Efficiency Standard (NVES) from 2025 plays a pivotal role in driving the shift to EV adoption. NVES imposes financial penalties on vehicle manufacturers if their fleet exceeds prescribed carbon emissions limits, specifically fines of up to $100 per gram of CO2 per kilometre per vehicle sold beyond the target. This pressure is forcing manufacturers to accelerate the development and supply of EVs in the Australian market.
Alongside these penalties, Australia has set targets aiming for 50% of new car sales to be electric by 2030 and achieving 100% EV sales by 2035. By implementing these regulatory standards, along with state and federal subsidies, tax exemptions, and investments in charging infrastructure, Australian policy will drive widespread EV adoption. The combined effect of government policy and market forces is expected to lower EV prices gradually, making them competitive with internal combustion engine vehicles by 2030. It’s a similar system that was adopted to promote the uptake of rooftop solar. Cheaper upfront purchase prices, along with operational cost savings from lower fuel and maintenance needs, are making EVs an increasingly attractive option for consumers.
The rise of EVs will significantly drive electricity demand across Australia. Each EV typically consumes around 2,000 kWh of electricity annually, which is substantial relative to the average household consumption of 4,000 to 8,000 kWh. As EV ownership rapidly grows—projected to surpass a million vehicles by 2028—residential electricity consumption will increase notably, especially from home charging during evenings and overnight.
Overall, financial penalties on high-emission vehicle production, coupled with comprehensive incentives and falling EV purchase costs will drive Australia’s EV uptake. This will lead to a sizable increase in electricity demand. Coupling EV adoption with rooftop solar and battery storage solutions is increasingly recognized as key to balancing household energy use.
One thing that is noteworthy concerning the government’s push for EV adoption is that there is a significant problem currently with daytime wholesale electricity prices falling into negative territory. EV adoption could mitigate this problem by increasing daytime electricity demand.
Inflation Forecast Summary:
Our study of electricity price inflation drivers has isolated rooftop solar uptake as the core driver of electricity price inflation. Realised prices paid by households across the board won’t increase that much because the offset from solar savings will be covered by those who don’t take up solar so that on balance, the price of electricity remains more or less the same on the aggregate. This will not be true for prices for those who depend on the grid for their electricity supply. We expect these prices to continue going up until 2030 and likely until 2035. The only capacity limitation on that inflation is the number of households in Australia.
One slice of inflation we can be reasonably certain about is the 2026-2030 period. During that time, conservatively we should expect a 20% annual inflation rate on account of the continued uptake of rooftop solar installations. For the 2026-2030 period, the core driver of inflation will be smart meter mandatory installations. This ought to result in higher solar installations in 2027 and 2028 than what we’ve seen so far. This is because a shoulder time component will be added to bills making them more expensive. This will in turn accelerate the inflation we are seeing on the grid as more households turn to solar. For 2025, electricity price inflation has already reached 23.6%. As we’ve established there’s also an inflationary backlog on the wholesale market which hasn’t showed up on utility bills yet. We believe this backlog is the reason for the rollout of smart meters. On aggregate, electricity prices are going to continue increasing at the same pace they did in 2026. In fact, it is likely they will increase by more than that as the electric bill increases fuel an even greater solar uptake which in turn continues to fuel electricity price inflation on the grid in a vicious inflationary cycle.
Another factor that will be driving solar installations is Australia’s EV target uptake. Whilst the additional capacity that will enter the market in wind power ought to put a dampener on inflation, this dampener will be mitigated by higher demand for electric vehicles. Whatsmore, since electricity prices will have become prohibitively expensive by 2030, we believe that a popular new way of adding solar to properties will be power purchase agreements and that this industry will see a lot of growth between 2030 and 2035. By 2035, it’s likely that the rooftop solar uptake is more likely to be in the 80% range than the 60% range because the inflation we will see between 2026 and 2030 will be unparallelled. Overall, as excessive as it may seem, we expect electricity price inflation on the grid between 2026 and 2029 to remain at 20% a year on average and then at 7% a year until 2035 to account for a tripling of prices relative to 2025.
Pressure is building from certain political parties to abandon the Net Zero target but so far, we are not seeing anything resembling consensus on the matter and it doesn’t seem as if there is a united political will in Australia to stop this policy from going forward as it is thus far supported by both the liberals and labor. Furthermore, many critics point out that the target of 82% of our electricity generated from renewables by 2030 is unrealistic (3). https://www.aer.gov.au/industry/registers/charts/annual-volume-weighted-average-30 minute-prices-regions
APPENDIX 1:
| Cost in Billions | Cost in Billions | |
| Cost of coal power plant production new | 16 | 31.60 |
| Cost to power coal power plants | 326 | 474.00 |
| Total Cost of Coal Over 15 years | 341 | 505.60 |
| 15 KWh battery unsubsidised LiFePO4 cost batteries for all households | 129 | 194 |
| 15 KWh battery unsubsidised LiFePO4 batteries for all households | 172 | 226 |
| 15 KWh battery unsubsidised low-cost batteries for all households | 64 | 136.00 |
| 15 KWh battery unsubsidised low-cost batteries for all households | 86 | 156.00 |
| Solar system size (3.5-5KWh) based on average personal consumption | 54 | 75.6 |
| Total cost low estimate | 118 | 211.60 |
| Total cost high estimate | 140 | 231.60 |
| Current installed wind power capacity | 13.3GW | |
| New wind power supply coming online by 2030 | 45 GW | |
| Cost of build | 174.9 | |
| Battery storage needed | 233.2 | 349.8 |
| Low estimate cost of storage | 46.6 | 70 |
| Total Low Estimate | 221.5 | 244.9 |
| Total High Estimate | 396.4 | 419.8 |
| Total households + wind low estimate* | 340 | 456.50 |
| Total households + wind high estimate* | 536 | 651.40 |
| * Meets 83-91% of country’s consumption needs. | ||
APPENDIX 2
| Year | 2025 | 2026 | 2027 | 2028 | 2029 | 2030 | 2031 | 2032 | 2033 | 2034 | 2035 |
| Total Electricity Consumption (TWh) | 276 | 280 | 284 | 288 | 292 | 296 | 300 | 304 | 308 | 312 | 316 |
| Estimated New EV Sales (units) | 130,000 | 170,000 | 220,000 | 275,000 | 335,000 | 400,000 | 480,000 | 560,000 | 640,000 | 720,000 | 800,000 |
| Total Private Vehi- cle EV Fleet | 430,000 | 600,000 | 820,000 | 1,095,000 | 1,430,000 | 1,830,000 | 2,310,000 | 2,870,000 | 3,510,000 | 4,230,000 | 5,030,000 |
| EV Annual Cum Electricity Con- sumption (TWh/year) | 0.88451 | 1.2342 | 1.68674 | 2.252415 | 2.94151 | 3.76431 | 4.75167 | 5.90359 | 7.22007 | 8.70111 | 10.34671 |
| Cumulative Com- mercial EV Fleet (units) | 20,000 | 55,000 | 110,000 | 195,000 | 320,000 | 470,000 | 650,000 | 860,000 | 1,100,000 | 1,380,000 | 1,700,000 |
| Cumulative Com- mercial EV Electric- ity Consumption (TWh) | 0.07 | 0.2 | 0.4 | 0.71 | 1.17 | 1.72 | 2.37 | 3.14 | 4.01 | 5 | 6.2 |
| AI/Data Centres (TWh) | 4.6 | 5.2 | 5.9 | 6.7 | 7.5 | 8.4 | 9.3 | 10.2 | 11.1 | 12 | 13 |
| Cumulative Immi- grant Electricity Consumption (TWh) | 0.454 | 0.78 | 1.054 | 1.321 | 1.631 | 1.998 | 2.413 | 2.891 | 3.402 | 3.956 | 4.547 |
| Other Electrifica- tion Loads (TWh) | 6 | 6.5 | 7.1 | 7.7 | 8.3 | 9 | 9.7 | 10.4 | 11.1 | 11.8 | 12.5 |
| Total Added De- mand TWh | 12.0085 | 13.914 | 16.1407 | 18.68342 | 21.54251 | 24.88231 | 28.53467 | 32.53459 | 36.83207 | 41.45711 | 46.59371 |
APPENDIX 3: Highlights from the research paper the renewable energy honeymoon is over:
“No country has reached wind and solar penetration levels above 90%, and those that come closest have some of the highest electricity costs in the world. Very few countries have exceeded around 40%, and those that do end up with elevated electricity prices.”
“Additional costs are already being encountered, at renewable energy penetration levels at or below 30%. Australian Energy Regulator (AER) Chair Clare Savage has warned of a “wall of capex” coming at consumers from distribution network augmentations, which “will be baked in not just for today but for many years to come” and “could more than offset the lower costs of wholesale energy as we make the switch to renewables unless we find ways to be more efficient”.”
“The end of the renewables honeymoon is now deindustrialising Germany, with data from the German Chamber of Industry and Commerce indicating 40% of industrial companies are considering partly or fully relocating operations abroad due to a lack of affordable and reliable energy.”
“California offers a parallel tale. The state’s aggressive renewables rollout has seen wind and solar penetration soar past 30% by the late 2010s. As a result, Californian electricity prices have risen from around 10% higher than the US average in the late 1980s to over 80% higher than average in 2024. Customers without rooftop solar there are forced to pay ever-increasing cross-subsidies to those with rooftop solar. There is now a serious risk that broadscale grid defection will precipitate a utility death spiral, with fewer and fewer customers having to cover growing system costs, worsening energy affordability.”
One assumption we make in our calculations of coal vs renewable energy cost affordability is that the storage needed meets certain levels that are traditionally required for a wind farm installation. In other words, it uses commonly accepted averages. The authors of the paper disagree with that method. Here’s what they have to say about it: “increasing the share of energy stored will also increase the average length of time over which it is stored. The heterogeneity of real weather means that multi-day or seasonal storage is eventually required, which reduces the frequency of storage cycles, and hence utilisation of capital. This inevitably increases system costs per unit of delivered energy.”
“AEMO has warned that unless it has the power to curtail the amount of rooftop solar flooding into the grid, more drastic and damaging measures would need to be taken. These include increasing voltage levels in parts of the network to deliberately trip rooftop solar inverters or shedding parts of the network with too much rooftop solar output.” There is a high likelihood this situation will result in blackouts in Queensland, Victoria and South Australia.
“As more solar and wind farms are built with highly correlated output, curtailment will only increase, with greater capital costs needing to be recovered from a smaller amount of generation, increasing price per kWh.”
“The mismatch between when weather-dependent energy is produced and when it is needed is needing to be resolved by increasing the amount of storage available. The high cost of batteries must be recouped by investors, which necessarily adds to the overall system costs and therefore electricity prices paid for by consumers.”
“Assuming that the rollout is proceeding on an efficient ‘least cost’ pathway, this still means that overall cost per unit of electricity delivered will continue to rise. Any downward pressure on prices can only arise momentarily, as the correction of previous suboptimal investment choices. On an efficient build-out, the amount of capital per unit of energy delivered must inexorably rise.”
“The more transmission is built to carry the same amount of electricity, the higher the additional costs for consumers.” “Unprecedented levels of new transmission, not to mention other system costs, to deliver similar amounts of energy logically translates to unprecedented costs for
consumers.” “In 2023, AEMO confirmed there had been “unprecedented cost increases” observed across the transmission sector, with project cost estimates showing increases in real costs of up to around 30% compared to equivalent cost estimates prepared for the 2022 ISP. In 2025, even greater cost increases have been observed. AEMO has confirmed that, since 2024, real costs for overhead transmission line projects have blown out by a further 25% to 55% and substation projects by 10% to 35%.”
“Government analysis indicates that “to meet net-zero targets using onshore renewables could require up to 70% of Victoria’s agricultural land to host wind and solar farms”.”
“Governments have been delaying coal plant closures out of concern that the announced schedule of retirements would unjustifiably increase the risk of blackouts.”
“As more intermittent renewable generation enters the grid — particularly during peak solar output in the middle of the day — prices have frequently been suppressed to low or even negative levels. This clearly signals that additional renewable capacity increasingly offers limited to no economic value due to the growing mismatch between renewable generation and actual market demand.”
The report notes that due to the return on investment of large-scale renewables projects not being attractive enough, private investors have been reluctant to invest with the Clean Energy Council declaring that commitments are “well short of the pace required to meet Australia’s 82% renewable energy target by 2030”. Developers have to sell the energy generated by their large-scale renewable projects onto the wholesale market. As discussed, this market is currently in a state of oversupply during the daytime.
The 2023 chart below illustrates that the price of electricity in Australia could increase by 150% if it ends up following the same trajectory as Denmark and Germany under a 40-60% penetration rate. Australia is already at a 40%+ penetration rate. Keep in mind the government is aiming for 82% by 2030: